
quality control equipment turns hidden production risks into measurable evidence. A slight burr on a machined edge, a 0.2-millimeter deviation, or a weak weld can affect safety, cost, and customer trust. This guide examines the top 10 types of quality control equipment used to detect such problems before products leave the factory.
The selection includes calipers, micrometers, coordinate measuring machines, optical vision systems, hardness testers, tensile testing machines, surface roughness testers, leak detectors, weighing systems, and environmental chambers. Each tool serves a different purpose. Some measure dimensions. Others evaluate strength, appearance, weight, temperature resistance, or sealing performance. Together, they support more consistent decisions on the production floor.
W. Edwards Deming, a leading quality management expert, stated, “Quality comes not from inspection, but from the improvement of the production process.” His point remains practical. A gauge may reveal an oversized part, but it cannot repair a poorly controlled process. Reliable quality control equipment must be calibrated, correctly operated, and matched with clear inspection standards. Operators also need experience, because a clean digital reading can still hide poor sampling or incorrect setup.
No device is perfect.
This article considers accuracy, repeatability, operating range, maintenance needs, and workplace application. It also recognizes an uncomfortable reality: the most advanced instrument can fail when teams ignore training or measurement uncertainty. The right equipment is not always the most expensive option. It is the tool that produces dependable evidence for the decision being made.
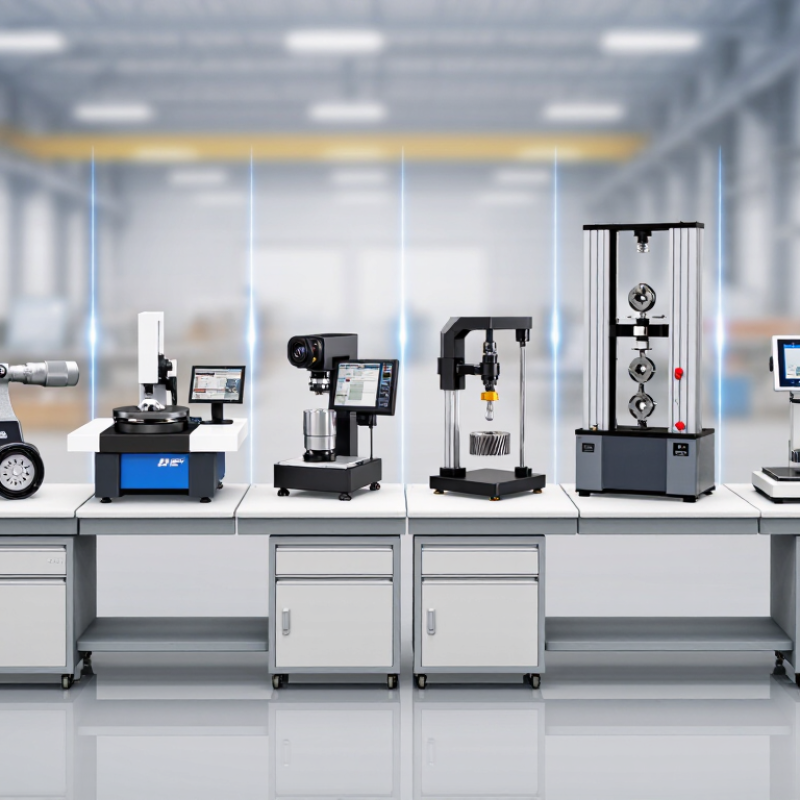
Dimensional measurement tools convert production claims into evidence. Calipers handle quick checks on outside, inside, and depth dimensions. Micrometers provide finer resolution for shafts, plates, and controlled fits. Coordinate measuring machines, or CMMs, capture multiple points and compare them with a digital model. The choice depends on tolerance, geometry, speed, and operator skill.
A 2024 Grand View Research analysis valued the global CMM market at approximately USD 3.6 billion in 2023. It forecasts about 7.4% annual growth through 2030. That expansion reflects tighter tolerances and stronger demand for automated inspection. Yet sophisticated equipment cannot repair poor measurement practice. Temperature, surface debris, probe alignment, and clamping force can change results. A clean-looking reading may still be wrong.
Calibration records should identify traceability, uncertainty, and the measurement conditions. NIST guidance emphasizes evaluating repeatability, reproducibility, and bias before trusting a measurement system. The ISO Survey 2023 reported more than 1.26 million ISO 9001 certificates worldwide, showing how widely controlled quality processes are used. In practice, technicians should verify a caliper against a known standard before checking a critical part. Micrometers need consistent contact pressure. CMM programs require validated fixtures and temperature control. Small details matter. I would not treat a CMM report as unquestionable evidence; an incorrect datum or unstable setup can produce highly convincing errors.

This chart compares representative measurement resolutions for commonly used quality control equipment. Smaller values indicate finer resolution; actual performance depends on instrument design, calibration, environmental conditions, and measurement range.
Key takeaway: Calipers are practical for general-purpose dimensional checks, while micrometers, gauge blocks, CMMs, and roundness testers support higher-resolution inspection and precision verification.
Surface and visual inspection equipment reveals defects that ordinary lighting often hides. Microscopes expose scratches, pits, burrs, coating gaps, and foreign particles on small components. Roughness testers measure the texture left by machining, polishing, or forming processes. Together, they provide practical evidence for quality decisions.
In daily inspections, I place the part under controlled lighting before using magnification. This simple step prevents dust from appearing like a surface defect. A microscope should offer stable focus, suitable magnification, and clear image capture. Excessive magnification can confuse operators. It may show harmless marks as serious problems. I record the defect location, size, direction, and surrounding surface condition.
Roughness testers require careful contact and consistent measurement paths. The probe should follow the specified direction across the surface, not randomly. Clean the part first, but avoid polishing away the actual condition. Calibration checks matter, especially after repeated shop-floor use. I once accepted a smooth-looking sample after one measurement. Later, tests from different locations showed uneven machining marks. That mistake taught me to measure several points. A microscope image can look convincing, yet it cannot replace numerical roughness data. Operators also need training, because judgment changes between people. Even reliable equipment produces weak results when setup records are incomplete.
Mechanical property testing is a core category among the top ten types of quality control equipment. Hardness testers measure resistance to indentation, scratching, or impact. Tensile testers reveal how a material behaves under controlled pulling force. Together, they help inspectors judge strength, consistency, and suitability for production.
A hardness test can be quick, but it still demands care. The test surface should be clean, flat, and free from scale or coatings that distort results. Operators must select the correct load, indenter, and dwell time for the material. Small errors matter. A thin component may show an artificially high reading if the support beneath it is too close. Regular verification with certified reference blocks improves measurement reliability.
Tensile testing provides a fuller picture. A prepared specimen is pulled until it yields or breaks, while the machine records force and elongation. These results can show yield strength, ultimate tensile strength, and ductility. Proper alignment is essential because a tilted specimen can create misleading stress patterns. Record everything: specimen dimensions, test speed, temperature, and fracture location. A neat graph can still hide a preparation mistake. That weakness deserves review, not dismissal. Calibration records, trained operators, and traceable procedures make the data more defensible during internal audits or customer inspections.
Material composition analysis is central to modern quality control. Industrial spectrometers identify elements, compounds, and contamination within seconds. Common systems include optical emission, X-ray fluorescence, and Fourier-transform infrared spectrometers.
A metal sample can produce a visible spectral fingerprint after preparation. Operators compare its peaks with certified reference materials and approved specifications. This process supports alloy verification, incoming inspection, and failure analysis. According to the MarketsandMarkets 2024 Spectroscopy Market report, the global spectroscopy market is projected to grow at more than 7% annually through the decade. That growth reflects stronger demand for faster, traceable measurements. ISO/IEC 17025 also emphasizes competent testing, calibrated equipment, and documented uncertainty. A number alone is not enough. Matrix effects, surface oxidation, moisture, and poor sampling can distort results. A clean spectrum can still mislead.
Tips: Clean the sample consistently, record its location, and test reference materials before production runs. Keep calibration records beside the instrument, not in an informal spreadsheet. Review unusual peaks with an experienced analyst. Overconfidence is a real risk; even skilled teams can overlook preparation errors. ASTM methods can guide material-specific procedures, but they should not replace site validation. Spectrometer data becomes reliable only when the method, operator, and sample history are controlled.
| Rank | Quality Control Equipment | Analytical Principle | Typical Composition Information | Common Quality Control Applications | Typical Sample Forms |
|---|---|---|---|---|---|
| 1 | X-ray Fluorescence Spectrometer (XRF) | Measures the characteristic secondary X-rays emitted by elements after excitation with primary X-rays. | Major, minor, and selected trace elements; especially elements from magnesium through heavier elements, depending on configuration. | Cement and mineral verification, alloy sorting, glass and ceramic control, coating analysis, and raw-material screening. | Solids, powders, fused beads, pressed pellets, liquids, and thin films. |
| 2 | Optical Emission Spectrometer (OES) | Uses an electrical spark or arc to excite atoms and measures their characteristic emitted light. | Quantitative elemental composition of metals, including carbon, sulfur, phosphorus, silicon, manganese, chromium, nickel, and molybdenum. | Incoming metal inspection, alloy grade identification, furnace control, certification testing, and production-line verification. | Prepared metal surfaces, bars, billets, castings, sheets, and finished components. |
| 3 | Laser-Induced Breakdown Spectrometer (LIBS) | A focused laser creates a micro-plasma on the sample surface; emitted plasma light is analyzed for elemental signatures. | Rapid multi-element screening, including light elements such as lithium, carbon, and hydrogen when instrument design permits. | Scrap sorting, alloy identification, battery-material screening, geological classification, and at-line process control. | Metals, ores, powders, rocks, ceramics, plastics, and other solid surfaces. |
| 4 | Inductively Coupled Plasma Optical Emission Spectrometer (ICP-OES) | An argon plasma atomizes and excites the sample; emitted wavelengths provide multi-element measurements. | Broad multi-element analysis from major constituents to low-concentration trace elements. | Metal impurity testing, plating-bath control, environmental compliance, fertilizer analysis, and quality testing of chemicals and minerals. | Acid-digested liquids, aqueous solutions, and liquid extracts from solids. |
| 5 | Inductively Coupled Plasma Mass Spectrometer (ICP-MS) | An argon plasma ionizes the sample, and a mass analyzer separates ions according to their mass-to-charge ratios. | Trace and ultra-trace elemental concentrations, isotope ratios, and contamination profiles. | High-purity material control, toxic-element testing, semiconductor chemicals, pharmaceutical raw materials, and environmental monitoring. | Prepared liquids, digested solids, and selected vapor or particulate introductions. |
| 6 | X-ray Diffractometer (XRD) | Analyzes the diffraction pattern produced when X-rays interact with the crystal lattice of a material. | Crystalline phases, mineral identity, phase proportions, crystallinity, lattice parameters, and residual stress. | Cement phase control, pharmaceutical polymorph testing, ceramics, catalysts, minerals, battery materials, and failure analysis. | Powders, thin films, coatings, bulk solids, and selected flat components. |
| 7 | Raman Spectrometer | Measures the frequency shifts in light scattered by molecular vibrations and crystal lattice modes. | Molecular identity, chemical bonding, polymorphic form, crystallinity, carbon structure, and stress-related material changes. | Raw-material identification, pharmaceutical form verification, polymer and pigment inspection, carbon-material characterization, and contamination checks. | Solids, powders, liquids, tablets, coatings, fibers, and transparent or translucent packages. |
| 8 | Fourier Transform Infrared Spectrometer (FTIR) | Measures infrared absorption associated with molecular vibrations and functional groups. | Organic and inorganic functional groups, polymer type, additives, oils, solvents, and chemical degradation products. | Polymer identification, incoming chemical verification, contamination investigation, adhesive and coating control, and lubricant analysis. | Solids, powders, liquids, films, fibers, gases, and surface residues using suitable sampling accessories. |
| 9 | Near-Infrared Spectrometer (NIR) | Uses near-infrared absorption bands and calibrated chemometric models to estimate composition and physical properties. | Moisture, protein, fat, cellulose, active ingredients, blend uniformity, and other composition-related properties. | Fast non-destructive process monitoring, pharmaceutical blend uniformity, food and feed testing, polymer inspection, and moisture control. | Powders, granules, tablets, liquids, slurries, agricultural products, and packaged materials. |
| 10 | Combustion Elemental Analyzer | Combusts or chemically converts a sample and measures the resulting gases to determine specific elemental concentrations. | Carbon, hydrogen, nitrogen, sulfur, oxygen, and other elements depending on the analyzer configuration. | Fuel and petroleum testing, polymer and rubber quality control, soil and fertilizer analysis, biomass characterization, and metal carbon or sulfur verification. | Solids, powders, liquids, oils, fuels, polymers, soils, and biological materials. |
Note: Analytical range, detection capability, sample preparation, and measurement speed vary according to instrument configuration, calibration model, matrix, and applicable test method.
Among the top ten types of quality control equipment, gauges and data loggers provide essential process and environmental checks. Gauges show immediate readings for pressure, temperature, thickness, flow, or dimensions. Operators can spot a drifting value before it damages a production batch. A clear display also supports quick decisions beside the machine.
Data loggers record conditions over time. They can track temperature inside storage rooms, humidity near sensitive materials, or vibration during equipment operation. A logger placed beside a sealed container may reveal a six-hour temperature rise that a single inspection misses. Accurate timestamps connect abnormal readings with specific shifts, deliveries, or maintenance activities. This record strengthens traceability during internal reviews and customer investigations.
Good control depends on more than buying instruments. Each gauge needs a defined measurement range, suitable resolution, and scheduled calibration. Data loggers require secure placement, battery checks, and protected files. A sensor mounted too close to a cooling outlet can produce misleading results. We have seen clean-looking records hide gaps caused by dead batteries or incorrect clock settings. That weakness deserves attention, not excuses. Technicians should compare critical readings with a verified reference and document every adjustment. Even a reliable instrument can fail when people skip basic checks. Calibration labels help, but they cannot replace trained judgment.
For an immediate response, please call this
number08045801431
Price:
